Talaksan:Correlation examples2.svg
Pumunta sa nabigasyon
Pumunta sa paghahanap

Size of this PNG preview of this SVG file: 506 x 231 na pixel. Ibang resolusyon: 320 x 146 na pixel | 640 x 292 na pixel | 1,024 x 467 na pixel | 1,280 x 584 na pixel | 2,560 x 1,169 na pixel.
Orihinal na file (SVG na file, nominal na 506 × 231 (na) pixel, laki: 2.18 MB)
Buod
| Paglalarawan |
English: redesign File:Correlation_examples.png using vector graphics (SVG file) |
| Petsa | |
| Pinagmulan | Sariling gawa, original uploader was Imagecreator |
| May-akda | DenisBoigelot, original uploader was Imagecreator |
| Permiso (Muling paggamit sa file) |
Released into the public domain (by the authors). |
| Iba pang mga bersyon |
Derivative works of this file: CovrarianceCorrelation.svg File:Correlation_examples.png |
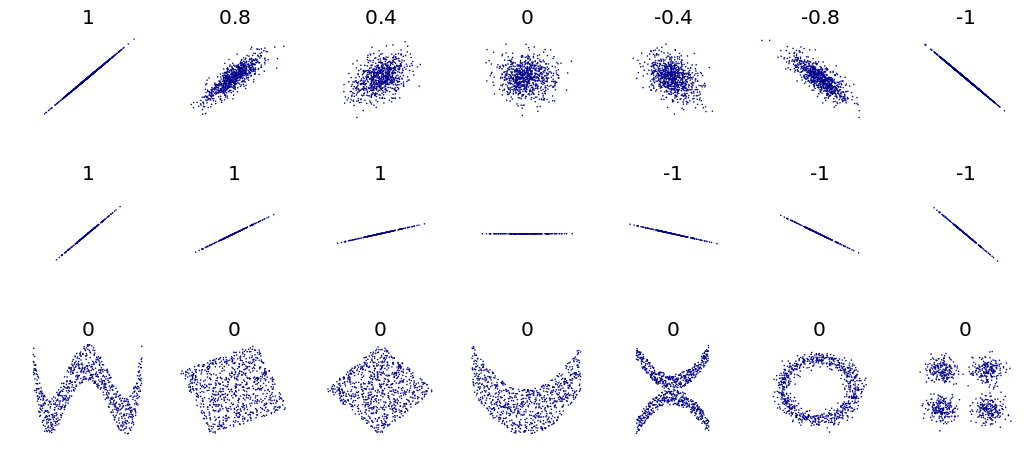
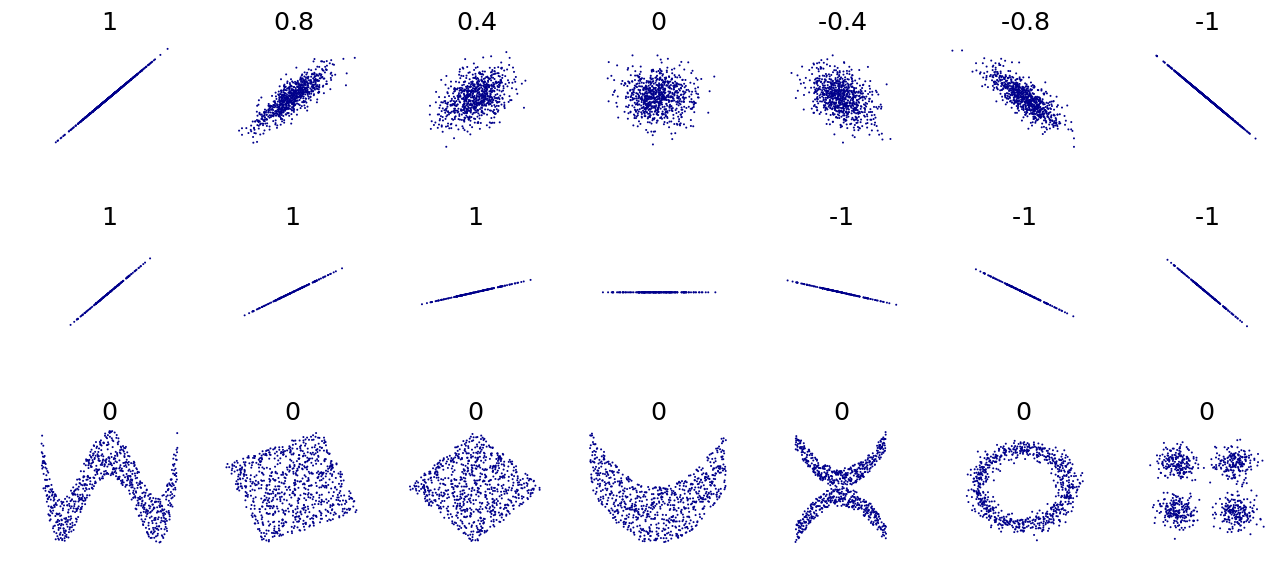
#Title: An example of the correlation of x and y for various distributions of (x,y) pairs
#Tags: Mathematics; Statistics; Correlation
#Author: Denis Boigelot
#Packets needed : mvtnorm (rmvnorm), RSVGTipsDevice (devSVGTips)
#How to use: output()
#
#This is an translated version in R of an Matematica 6 code by Imagecreator.

library(mvtnorm)
library(RSVGTipsDevice)

MyPlot <- function(xy, xlim = c(-4, 4), ylim = c(-4, 4), eps = 1e-15) {
   title = round(cor(xy[,1], xy[,2]), 1)
   if (sd(xy[,2]) < eps) title = "" # corr. coeff. is undefined
   plot(xy, main = title, xlab = "", ylab = "",
        col = "darkblue", pch = 16, cex = 0.2,
        xaxt = "n", yaxt = "n", bty = "n",
        xlim = xlim, ylim = ylim)
}

MvNormal <- function(n = 1000, cor = 0.8) {
   for (i in cor) {
      sd = matrix(c(1, i, i, 1), ncol = 2)
      x = rmvnorm(n, c(0, 0), sd)
      MyPlot(x)
   }
}

rotation <- function(t, X) return(X %*% matrix(c(cos(t), sin(t), -sin(t), cos(t)), ncol = 2))

RotNormal <- function(n = 1000, t = pi/2) {
   sd = matrix(c(1, 1, 1, 1), ncol = 2)
   x = rmvnorm(n, c(0, 0), sd)
   for (i in t)
      MyPlot(rotation(i, x))
}

Others <- function(n = 1000) {
   x = runif(n, -1, 1)
   y = 4 * (x^2 - 1/2)^2 + runif(n, -1, 1)/3
   MyPlot(cbind(x,y), xlim = c(-1, 1), ylim = c(-1/3, 1+1/3))

   y = runif(n, -1, 1)
   xy = rotation(-pi/8, cbind(x,y))
   lim = sqrt(2+sqrt(2)) / sqrt(2)
   MyPlot(xy, xlim = c(-lim, lim), ylim = c(-lim, lim))

   xy = rotation(-pi/8, xy)
   MyPlot(xy, xlim = c(-sqrt(2), sqrt(2)), ylim = c(-sqrt(2), sqrt(2)))

   y = 2*x^2 + runif(n, -1, 1)
   MyPlot(cbind(x,y), xlim = c(-1, 1), ylim = c(-1, 3))

   y = (x^2 + runif(n, 0, 1/2)) * sample(seq(-1, 1, 2), n, replace = TRUE)
   MyPlot(cbind(x,y), xlim = c(-1.5, 1.5), ylim = c(-1.5, 1.5))

   y = cos(x*pi) + rnorm(n, 0, 1/8)
   x = sin(x*pi) + rnorm(n, 0, 1/8)
   MyPlot(cbind(x,y), xlim = c(-1.5, 1.5), ylim = c(-1.5, 1.5))

   xy1 = rmvnorm(n/4, c( 3,  3))
   xy2 = rmvnorm(n/4, c(-3,  3))
   xy3 = rmvnorm(n/4, c(-3, -3))
   xy4 = rmvnorm(n/4, c( 3, -3))
   MyPlot(rbind(xy1, xy2, xy3, xy4), xlim = c(-3-4, 3+4), ylim = c(-3-4, 3+4))
}

output <- function() {
   devSVGTips(width = 7, height = 3.2) # remove first and last line for no svg exporting
   par(mfrow = c(3, 7), oma = c(0,0,0,0), mar=c(2,2,2,0))
   MvNormal(800, c(1.0, 0.8, 0.4, 0.0, -0.4, -0.8, -1.0));
   RotNormal(200, c(0, pi/12, pi/6, pi/4, pi/2-pi/6, pi/2-pi/12, pi/2));
   Others(800)
   dev.off() # remove first and last line for no svg exporting
}
Lisensiya
Ako, na may karapatang-ari ng akdang ito, ang naglalathala nito alinsunod sa ilalim ng sumusunod na mga lisensya:
| Ang talaksang ito ay ginawang makukuha sa ilalim ng Dedikasyon ng Pandaigdigang Saklaw ng Madla CC0 1.0 ng Creative Commons. | |
| Ang taong nag-ugnay ng isang akda sa kasulatang ito ay inilaan ang akda sa Commons sa saklaw ng madla
na isinusukong pangbuong-mundo ang lahat ng kanyang mga karapatan sa akda sa ilalim ng batas sa karapatang-ari, kasama ang lahat ng kaugnay at karatig na mga karapatan, hanggang sa naaabot ng batas. Maaari mong kopyahin, baguhin, ipamahagi at isagawa ang akda, kahit na para sa mga layunin pangkalakal, lahat-lahat na hindi nangangailangan ng pahintulot. |
Nakaraan ng file
Pindutin ang isang petsa/oras para makita ang file noong puntong yon.
| Petsa/Oras | Thumbnail | Sukat | Tagagamit | Komento | |
|---|---|---|---|---|---|
| ngayon | 07:00, 10 Mayo 2011 | | 506 × 231 (2.18 MB) | wikimediacommons>DenisBoigelot | {{Information |Description ={{en|1=fd}} |Source ={{own}} |Author =DenisBoigelot |Date = |Permission = |other_versions = }} fjdk |
Paggamit sa file
Ginagamit ng sumusunod na pahina ang file na ito: